Mark Higginson
How attention flows on the web
No one publishes content to the public web without the intention of being seen by as many people as possible. We can represent this attention in different ways, such as the number of times a page is viewed or the time spent looking at it. Chartbeat has sought to standardise attention minutes indicating the importance of having an understandable metric for comparison; this is especially important if you sell that attention to advertisers.
The number of links pointing to a page is the ultimate arbiter of attention, for it's this act of sharing that fixes a page in the topology of the wider web – affecting all subsequent activity.
There are fundamental rules that govern how this attention flows from page-to-page that, while easy to understand, has huge ramifications for whether the things you create will be seen.
The rule is that only a minority of pages receive a majority of people's attention over any given period of time. This is due to the structure of the web itself — formed of an ever increasing number of pages and defined by their complex and shifting links to one another.
Many networks exist like this in nature, however it was the evolution of the web that made the study of these 'network effects' easier. Barabasi and Albert published a paper, Statistical mechanics of complex networks (2002), that found in a given sample of pages that linked to one another a few would be disproportionately popular. Because of that popularity it would be more likely that subsequent links within the network from new or existing pages would show a preferential attachment for these 'hubs', thereby increasing their popularity.
As users, because we rely on links to take us from page-to-page, it's inevitable our attention becomes focused on these places, both because links lead to these pages but also because a significant hub distributes attention among other pages to which it links.
I've prepared a series of charts to illustrate this point. Here are the most popular websites according to Quantcast:

The effect looks remarkable. Each point represents a website. Despite the vast number of sites that comprise the web and the vast number of pages that comprise these sites, attention is intensely focused around just a few: Google, YouTube and Facebook.
However, any website is simply a collection of strongly interlinked pages therefore we'll see the same pattern if we look at an individual site. The most viewed pages, in order of popularity, from the site of a university I work with looks like this:
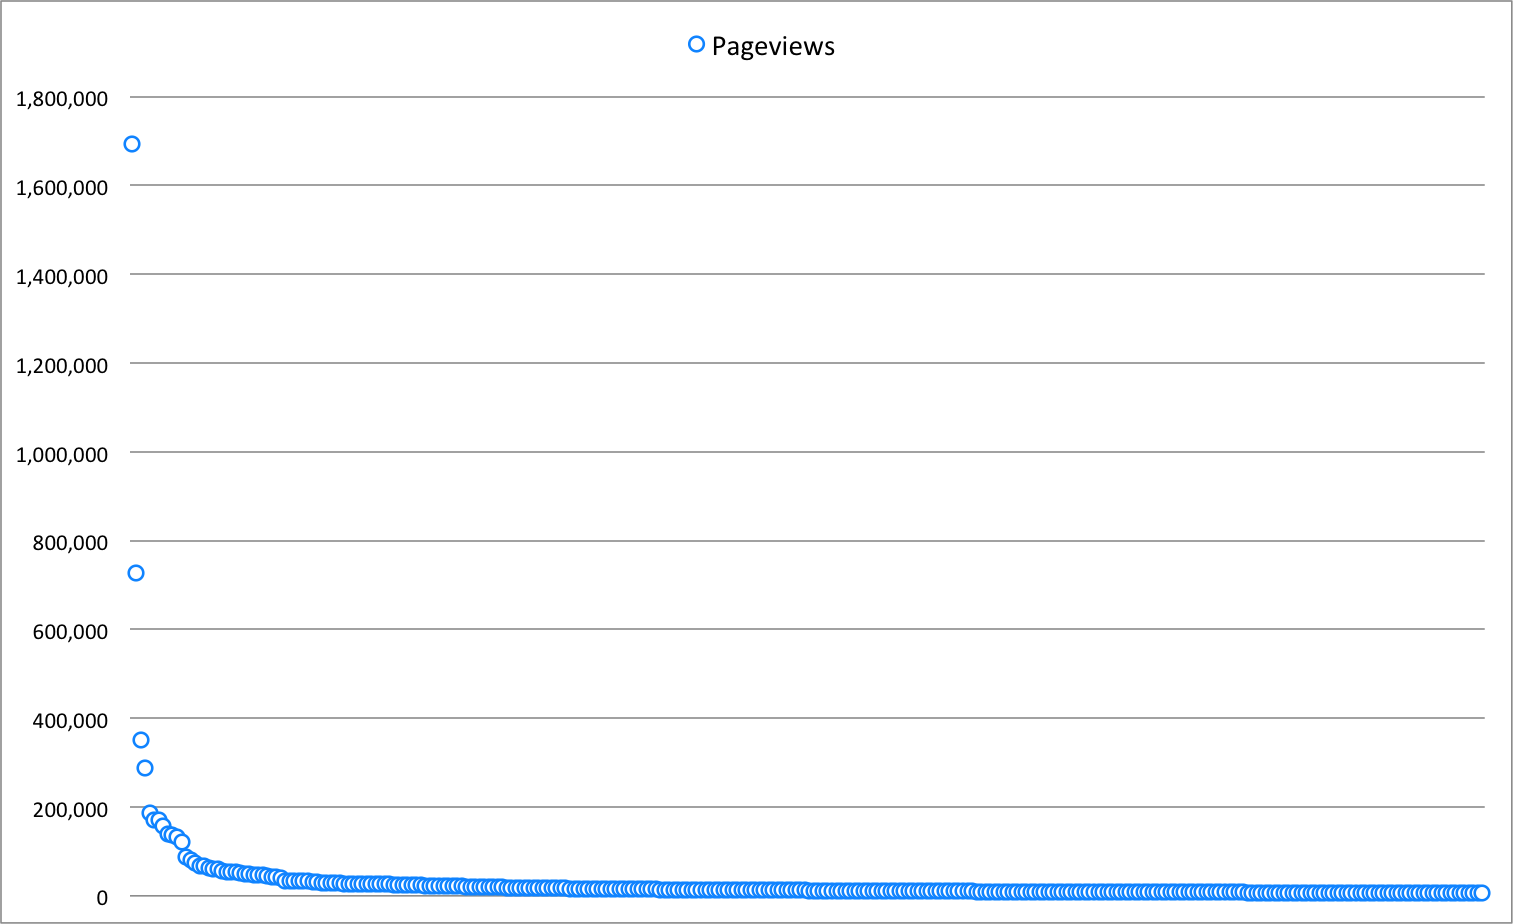
The site consists of several thousand pieces of content and attracts huge numbers of visitors who look at millions of pages a year, providing a great illustration of this effect. The chart shows the top 500 most visited pages as individual points, roughly a sixth of the total site. Note how the points describe a steep curve, from the twelve most popular pages attracting over 100,000 views to the bottom 217 pages in this set attracting just over 1,000 views each for the time period examined.
Those top twelve pages attract a third of all visits to the site as a whole! If you have access to the analytics data for a site you work on try plotting this yourself. You will see a similar distribution.
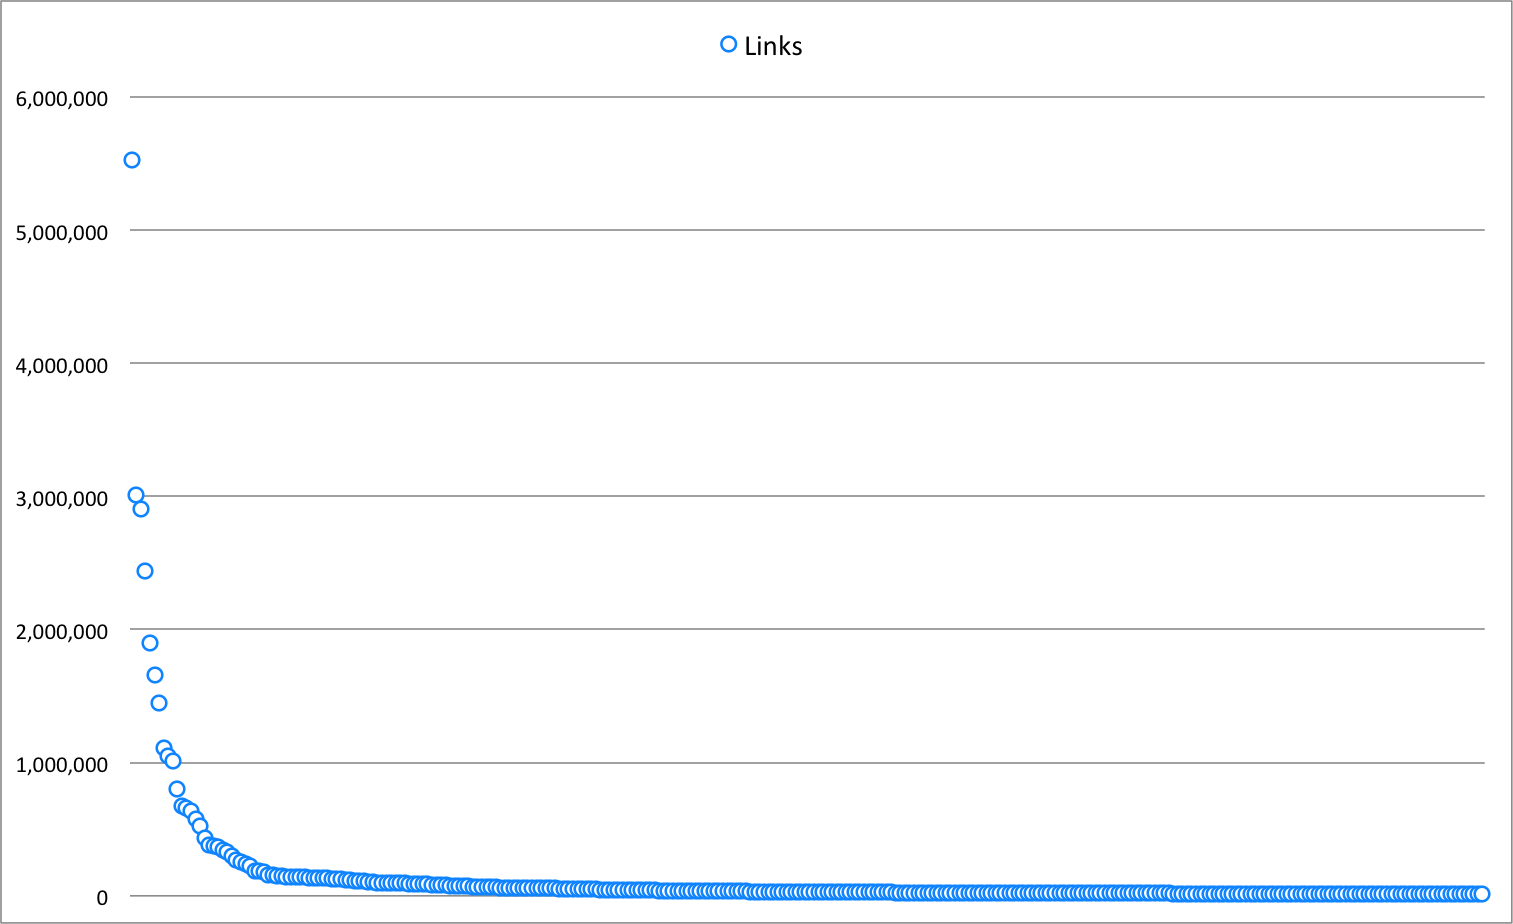
We've established total visits to major sites follow this pattern and that as a result the pages that comprise those sites must also follow this pattern. I mentioned earlier how links follow this distribution too and that these are signifiers of 'attention'; the chart below shows links from other websites that point to the university website.
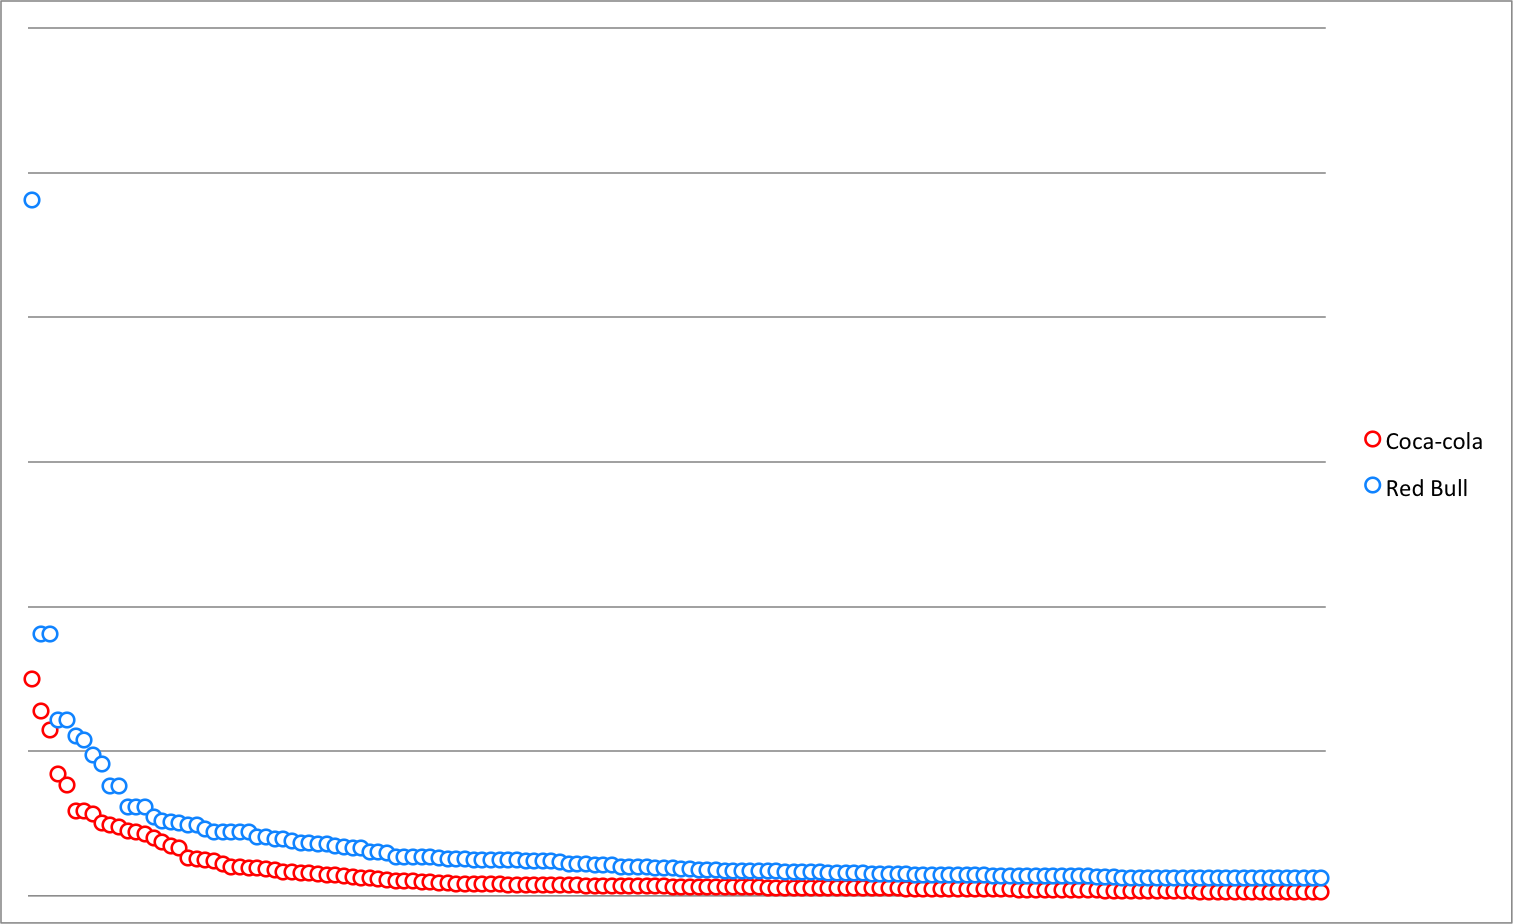
The same pattern applies to other behaviours. The sharing of items on social networks is just a form of link. Red Bull are continually cited by marketers as being exemplars for how a 'brand' can gain attention from a desired 'audience' through publishing specific types of appealing content. The chart below shows how often content from the main Red Bull site was 'Liked' on Facebook:
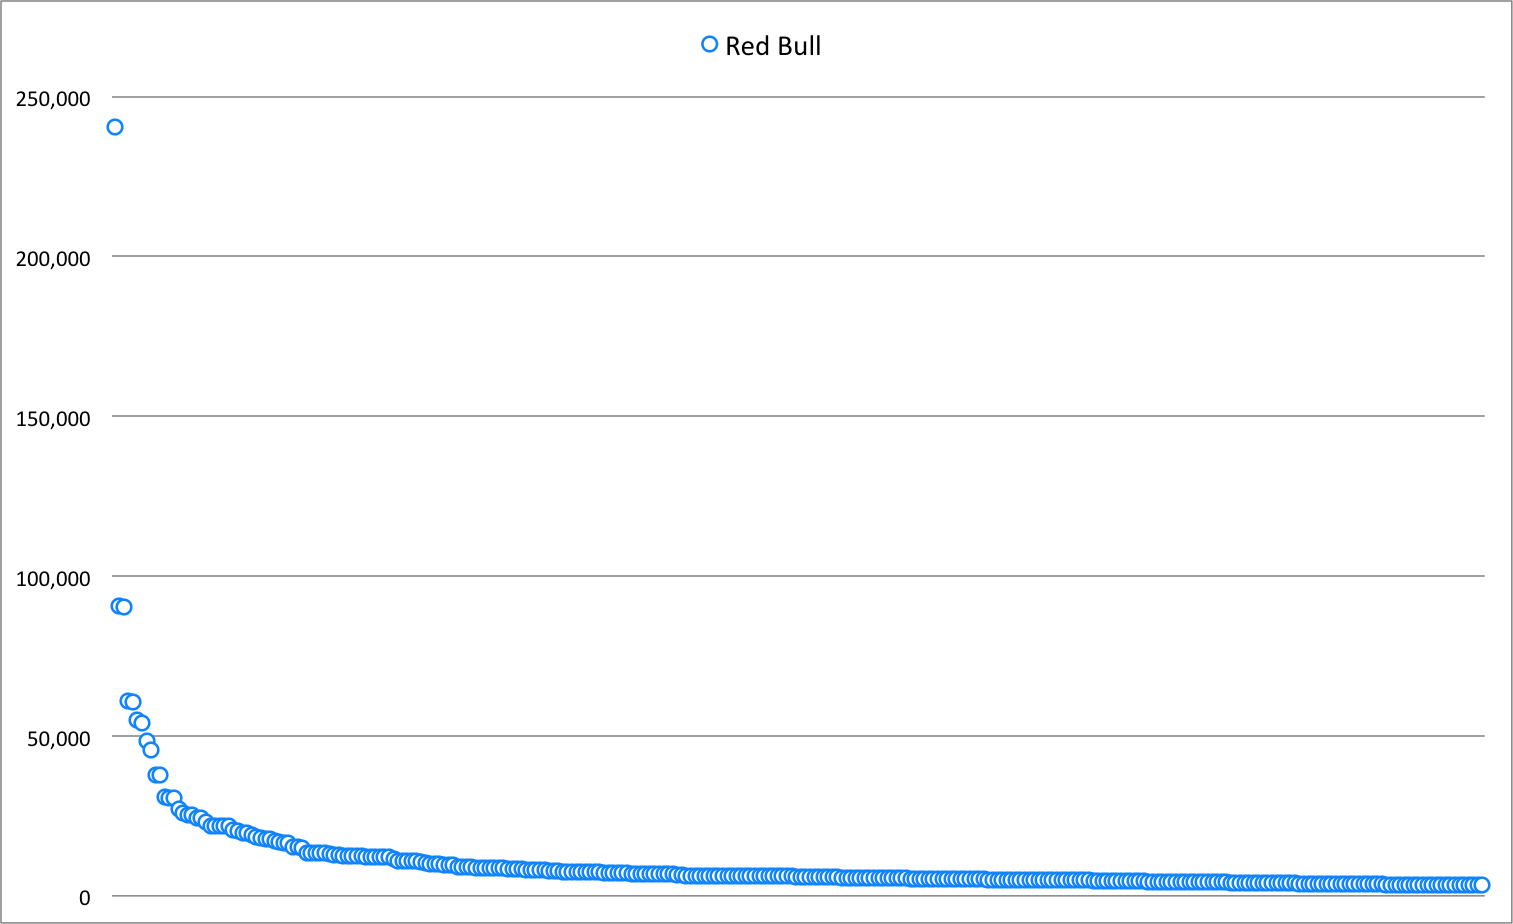
The top performing item was the Danny MacAskill 'Imaginate' film. It received as many Likes as the bottom 213 items in this sample.
Coca-Cola aren't as focused in their content production and perform poorly, a point I made in an award-winning post over on Sparksheet:
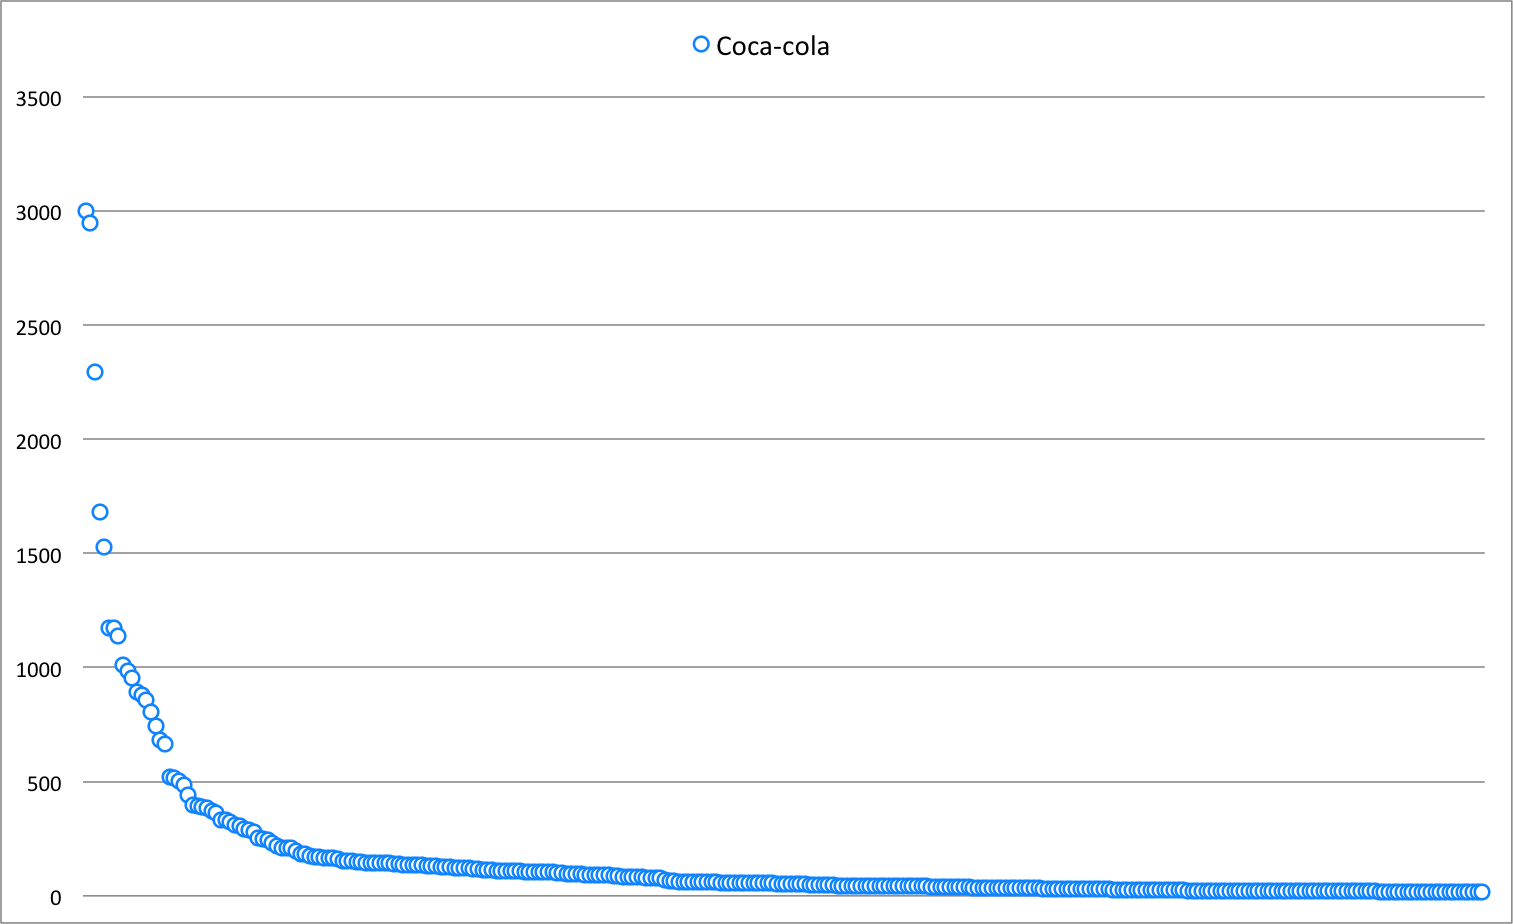
If we overlay the two charts you can see that despite the massive difference in popularity between Red Bull's posts and Coca-Cola's the shape of the distribution is remarkably similar:
Let's overlay all of the charts we've looked at so far of these ostensibly different characteristics:
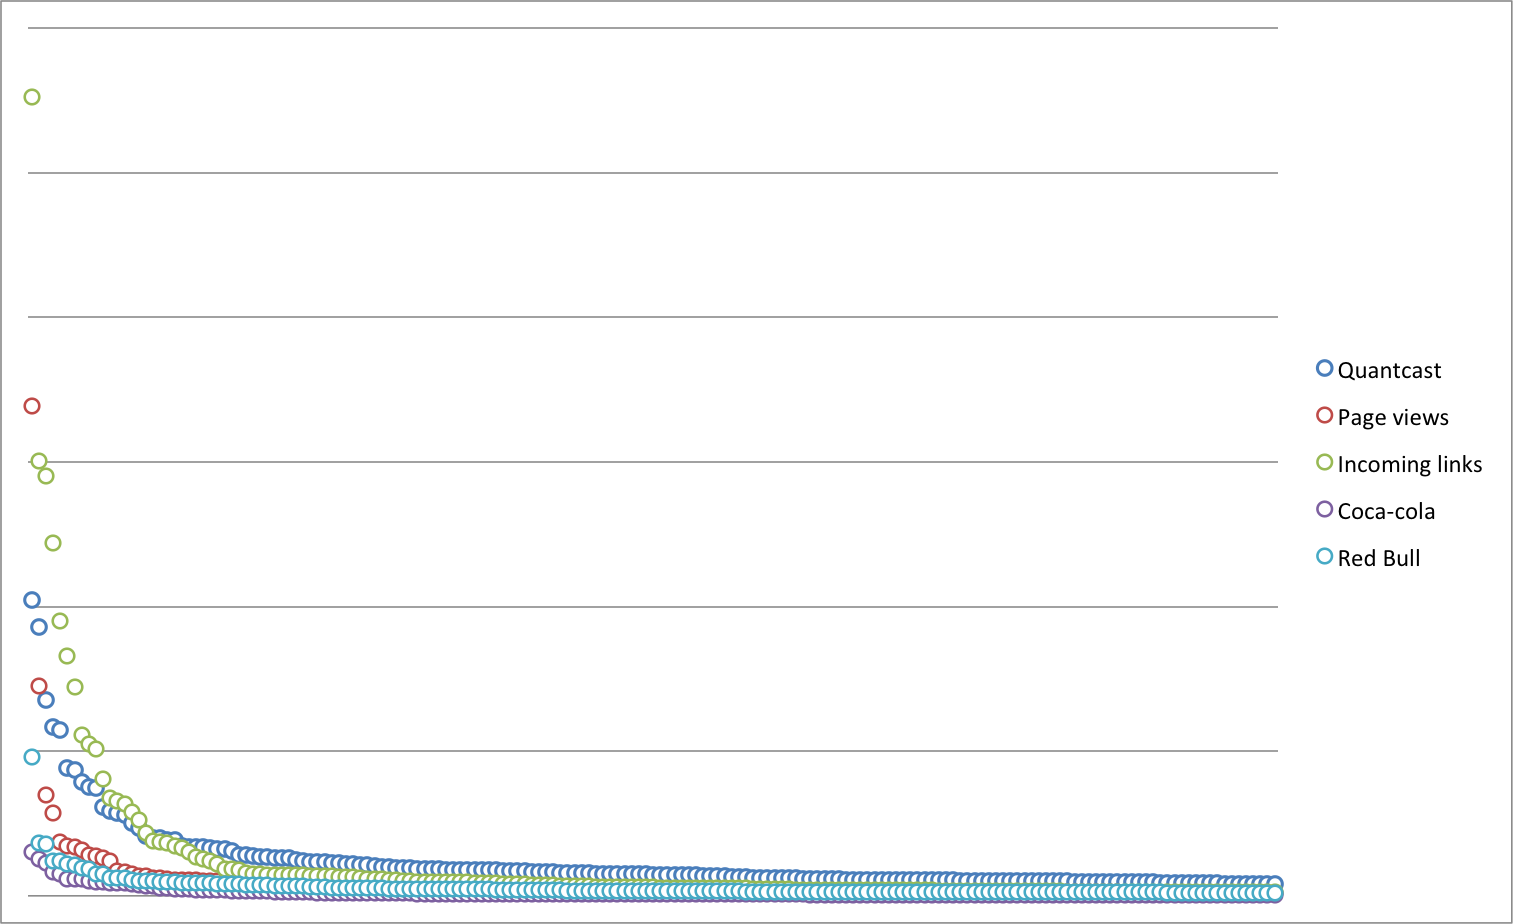
We can clearly see how there are always only a few points that disproportionately outperform the rest. Bear in mind that in each case the ‘tail’ extends much further than the top 300 points I’m representing in each case on the chart.
We are visualising a fundamental rule that applies to your web publishing activity too.
For web users this is simply an interesting observation of a naturally occurring phenomenon, much like the logarithmic spiral. For those working in marketing the implications are far more significant as the creation and propagation of content requires investment with the resulting attention and subsequent interaction expected to lead to an eventual monetary return.
While this may have been unfamiliar to some there are no doubt readers who have read Chris Anderson's The Long Tail that highlights the above in a wider context. One of Chris' points was that this effect is the way that Amazon outperforms the traditional bookshop:
"When consumers are offered infinite choice, the true shape of demand is revealed. And it turns out to be less hit-centric than we thought. People gravitate towards niches because they satisfy narrow interests better, and in one aspect of our life or another we all have some narrow interest (whether we think of it that way or not)."
A shop has limited shelf space so will only ever focus on more popular inventory. Amazon, as a searchable database of interests connected to a vast warehouse, can store inventory at a cost that means it can afford to wait for that moment when someone, somewhere wants that obscure title they can't get anywhere else. Multiply that by many thousands of otherwise unavailable books, add convenience and habit and you have a vast retail operation the high street cannot compete with in terms of choice.
The relevance to the discipline of marketing is often misunderstood. Amazon makes its money because it doesn't have to create the inventory itself. The content on your website works on precisely the same principle with the exception that you're paying to write, print and promote every single book.
This is why reddit is successful but also why the entire content marketing industry that has sprung-up in recent years is perpetuating a massive fraud. For a 'brand' there is simply no viable way to recover the investment required to set-up and maintain a web-publishing operation if each page isn’t directly generating a monetary return. Trying to defy this fundamental rule is akin to trying to launching yourself into space by jumping. I salute the aspiration but you look ridiculous in the execution.